Statistical Test
This post is mainly based on
Type I error vs Type II error
- Type I error: rejection of a true null hypothesis
- Type II error: unable to reject a false null hypothesis
| $H_0$ is True | $H_0$ is False | |
| Not able to reject $H_0$ | Correct | Type II error |
| Reject $H_0$ | Type I error | Correct |
Hypergeometric & Binomial Random Variable
Fisher Exact Test
- Distribution: Hypergeometric
- Null hypothesis
- Two samples drawn from the same hypergeometric distribution
- Fisher’s exact test of independence
contingency table:
| True | False | Row Total | |
| Group 1 | $a$ | $b$ | $a + b$ |
| Group 2 | $c$ | $d$ | $c + d$ |
| Column Total | $a+c$ | $b+d$ | $n=a+b+c+d$ |
$p$ measures the probability that two groups in contingency table are sampled from same distribution:
\[p = \frac{ \binom{a+b}{a} \binom{c+d}{c} }{ {n} \choose {a+c} }\]Fisher Exact Test calculate the above probability of
- Getting the observed contingency table
- Getting contingency tables with more extreme distribution
It is called a “exact” test since it does not estimates the probability of a value of a test statistic; rather, it directly solve the combinatorial problem. When the number of observations is large, Fisher Exact Test is slow.
Chi-squared Test
- Distribution: Binomial
- Null hypothesis
- Two (or more) samples drawn from same binomial distribution
- Approximate Hypergeometric
- Null hypothesis: No difference between the expected frequencies and the observed frequencies in one or more categories of a contingency table
- Sample size requirement: $>1000$
- Reason: test statistic approaches the $\chi^2$ distribution asymptotically, error is high when sample size is small
- Yates’s correction for continuity
- Reason: requires the assumption that the discrete probability of observed binomial frequencies in the table can be approximated by the continuous chi-squared distribution
- Chi-square test of independence
- Small numbers in Chi-square and G-test
Continuous Random Variable
Two-sample t–tests
- Distribution: Normal
- Null hypothesis
- Two samples drawn from same normal distribution
- Independent Two Sample t-Test
Unequal sample sizes, similar variances $1/2 < \frac{s_{X_1}}{s_{X_2}} < 2$
\[t=\frac{\bar{X}_1- \bar{X}_2}{s_p \sqrt{1/n_1 + 1/n_2}}\] \[s_{p}={\sqrt {\frac {(n_1-1)s_{X_{1}}^{2} + (n_2-1)s_{X_{2}}^{2}}{n_1+n_2-2}}}\]Mann–Whitney U Test
- Also known as: Wilcoxon Rank-Sum Test
- Distribution: Nonparametric
- Null hypothesis
- $X$ and $Y$ drawn from same distribution
- Equivalently: $P(X_i > Y_i) = P(Y_i > X_i)$
- Assumptions
- Independent samples
- Equal variances
- Approximately normally distributed or large sample ($n_1, n_2 > 30$ for Central Limit Theorem)
- Procedure
- Pool data together, sort data in ascending order
- Convert data to ranks $(1, 2, 3,… Y)$
- Separate ranks back in to two samples
- Compute the test statistic U (averages the ranks in each group)
- Determine critical value of U from table
- Mann–Whitney U test
- For more than 2 groups: Kruskal-Wallis Test
- Assumptions: all sample drawn from same distribution
- “All sample drawn from same distribution” is NOT equivalent to “Each two of the sample drawn from different distribution”
- To test the latter, you need to run Mann–Whitney U test on each pair of the samples
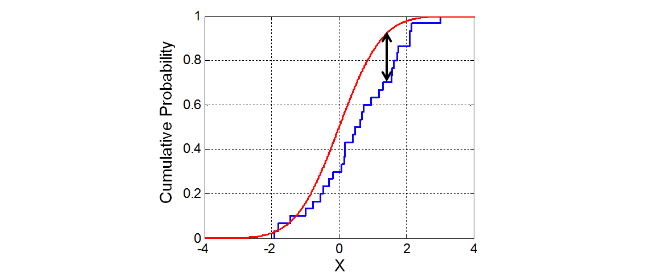
Kolmogorov-Smirnov Test
- Distribution: Nonparametric
- Null hypothesis
- Two samples are drawn from the same distribution
- $F(X) = F(Y)$
- Assumptions
- Variable at least ordinal
- Independent samples
- Use case
- Often used when the data have not met either the assumption of normality or the assumption of equal variances
- Procedure
- Measures distance between two empirical CDF
- $D_n=\sup_{x} | F_1(x)-F_2(x) | $
- Limitations
- Tends to be more sensitive near the center of the distribution than at the tails
- Only works with one-dimensional data (due to no obvious way to rank two-dimensional data)
- Kolmogorov–Smirnov test
- Beware the Kolmogorov-Smirnov test!
- Extension: Anderson-Darling test
- A modification of the Kolmogorov-Smirnov test, which assign more weight to the tails
Choice of Test
- Choosing a statistical test
- Contingency Table
- Small sample: Fisher Exact Test
- Large sample: Chi-squared Test
- Independent data
- Normal Data, Equal Variances: Equal Variance t-test
- Normal Data, Unequal Variances: Unequal Variance t-test
- Non-normal Data, Equal Variances: Mann-Whitney U-test
- Non-normal Data, Unequal Variances: Kolmogorov-Smirnov test
- Paired data
- Normal Data, continuous variable: Paired t-test