Neural Network on Tabular Data
This post is mainly based on
NN vs GBDTs on Tabular Data
- Experiments
- Compared 19 algorithms with up to 30 hyperparameter settings across 176 datasets
- Analyzed 965 metafeatures to determine what properties of a dataset make NNs or GBDTs better suited to perform well
- 10 train/validation folds for each dataset, in order to further reduce the uncertainty
- Finding 1: Models selection is not really important
- For a surprisingly high number of datasets
- The performance difference between GBDTs and NNs is negligible
- Light hyperparameter tuning on a GBDT is more important than selecting the best algorithm
- Finding 2: GBDTs are much better than NNs at handling irregular data
- Skewed feature distributions
- Heavy-tailed feature distributions
- Other forms of dataset irregularities
Preliminaries
- Issues with previous study
- Use fewer than 50 datasets
- Do not properly tune baselines
- Metafeatures
- Python library PyMFE: auto extract 965 metafeatures
- Categories
- General: number of datapoints, classes, or numeric/categorical features
- Statistical: min, mean, or max skewness, or kurtosis
- Information theoretic: Shannon entropy of the target
- Landmarking: performance of a baseline such as 1-Nearest Neighbor on a subsample of the dataset
- model-based: summary statistics for some model fit on the data, such as number of leaf nodes in a decision tree model
- Log of each strictly-positive metafeature for long-tailed distributions
Experiments
- Experimental design
- Algorithm run for up to 10 hours
- Hyperparameter sets: 1 default set and 29 random sets, using Optuna
- Each parameterized algorithm is given 2 hours to complete a train/evaluation cycle
- Overall performance: no algorithm dominates
- Nearly every algorithm ranks
- First on at least one dataset
- Last on at least one other dataset
- The best out of all algorithms (CatBoost) only achieved an average rank of 5.06
- Nearly every algorithm ranks
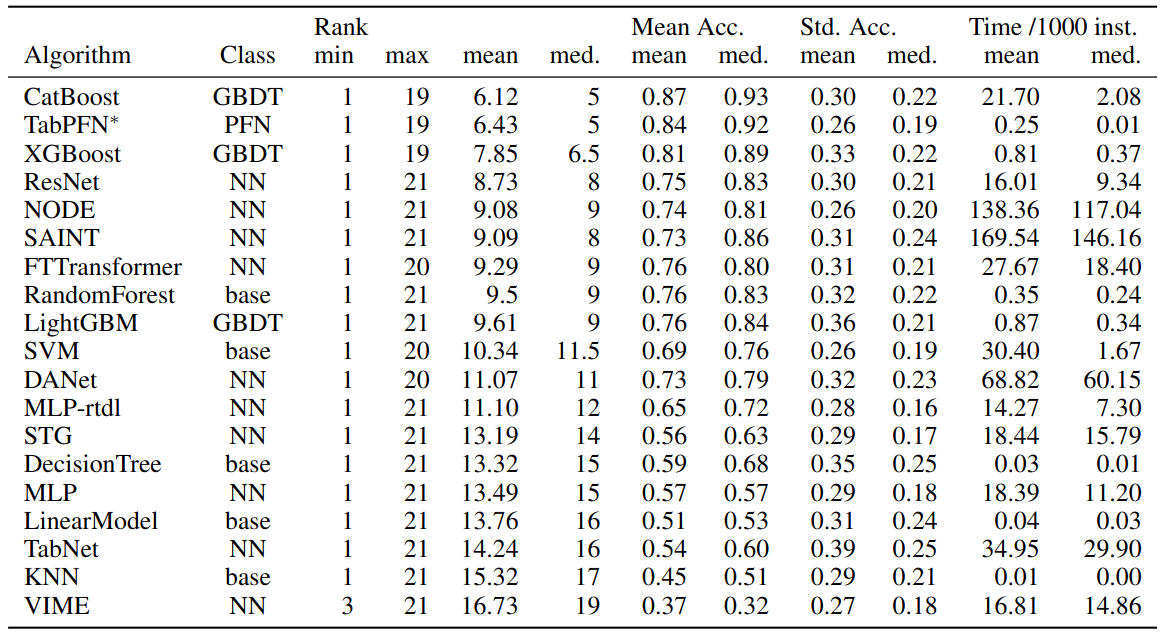
Performance of algorithms across 98 datasets. Columns show the algorithm family (GBDT, NN, PFN, or baseline), rank over all datasets, the average normalized accuracy (Mean Acc.), the std. dev. of normalized accuracy across folds (Std. Acc.), and the train time in seconds per 1000 instances. Min/max/mean/median of these quantities are taken over all datasets.
Time-Accuracy Scatter Plot
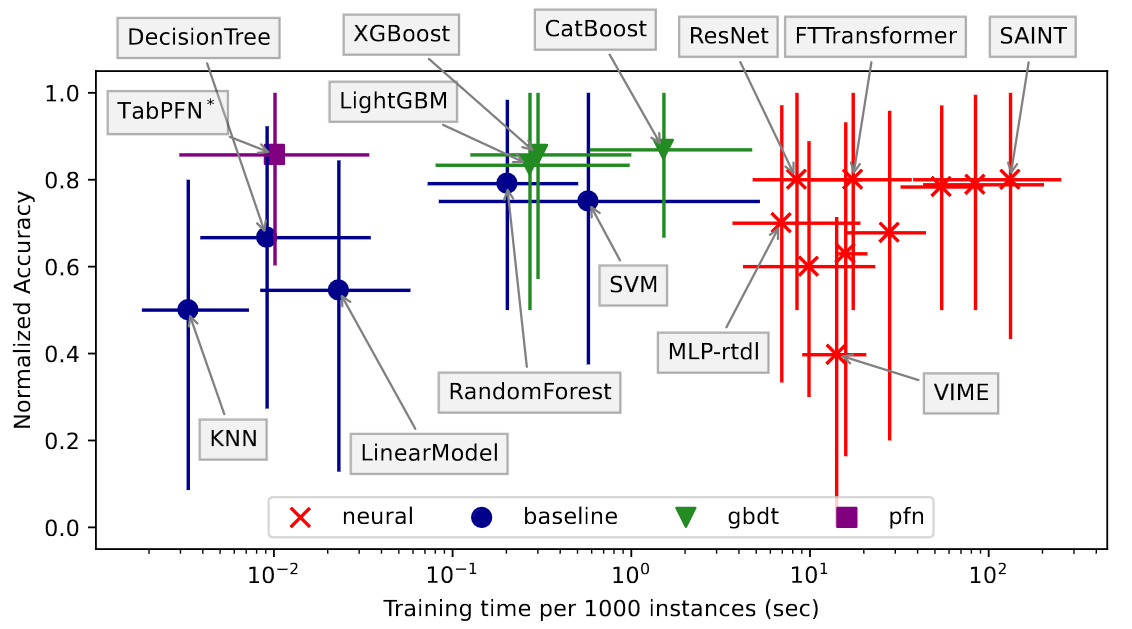
Median runtime vs. median normalized accuracy for each algorithm, over 98 datasets. The bars span the 20th to 80th percentile over all datasets.
Which Algorithm Family is High Performing?
- GBDTs is competitive in 55% of datasets
- Q. Should we:
- Select the best possible algorithm family?
- Run light hyperparameter tuning on an algorithm that generally performs well?
- A.
- Light hyperparameter tuning yields a greater performance improvement than GBDT-vs-NN selection for 1/3 of all datasets
- For a large fraction of datasets, it is not necessary to determine whether GBDTs or NNs are better
- Light tuning on an algorithm such as CatBoost or ResNet can give just as much performance gain
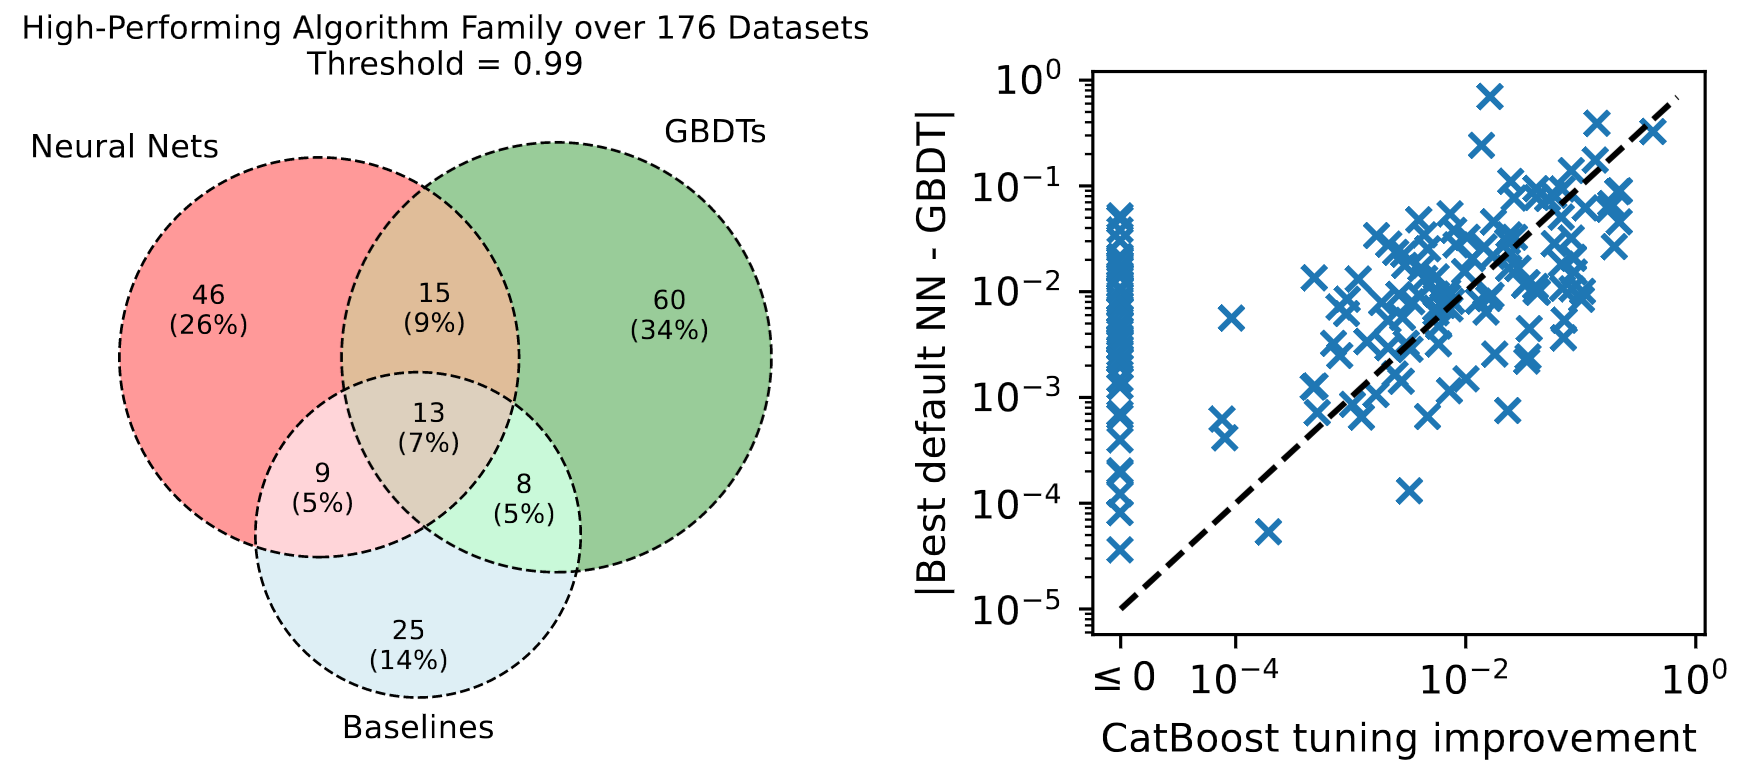
Left: Venn diagram of the number datasets where each algorithm is ‘high-performing’ for each algorithm class, over all 176 datasets. An algorithm is high-performing if its test accuracy after 0-1 scaling is at least 0.99.
Right: the performance improvement of hyperparameter tuning on CatBoost, compared to the absolute performance difference between the best neural net and the best GBDT using default hyperparameters. Each point indicates the normalized log loss of one dataset, Points on or below the dotted line indicate that the performance improvement due to tuning is as high as the difference between NN-GBDT algorithm selection.
Statistically Significant Performance Differences
- Friedman test: performance differences between each algorithm are significant
- Wilcoxon signed-rank test: which pairs of algorithms have significant performance differences
- Multiple testing: Holm-Bonferroni correction
- Findings: CatBoost is statistically significantly better than all other algorithms
Algorithm Selection vs Tuning
- Scenario: a practitioner can decide to
- Test several algorithms using their default hyperparameters
- Optimize the hyperparameters of a single model (CatBoost or ResNet)
- Measurement
- Impact of algorithm selection: best GBDT vs best NN in default hyperparameters
- Impact of hyperparameter tuning CatBoost:
- Impact of hyperparameter tuning ResNet:
- Results
- Catboost tuning better than algorithm selection: 53/176 datasets
- ResNet tuning better than algorithm selection: 63/176 datasets
- For a large fraction of datasets, hyperparameter tuning yield strong performance gain
Metafeature Analysis
- What properties of a dataset favor specific algorithms?
- Measure: Correlation between metafeature and $\Delta$(log loss of algorithms 1, log loss of algorithms 2)
- Results: GBDTs (CatBoost, XGBoost) tend to outperform NNs (ResNet, SAINT) on
- Irregular datasets
- Feature distributions are heavy-tailed, skewed, or have high variance
- Dataset with high class imbalance
- Larger datasets
- Surprisingly, LightGBM and XGBoost perform poorly for some smaller datasets, see paper Figure-5 Right
- Datasets with a high ratio of size to number of features
- Irregular datasets
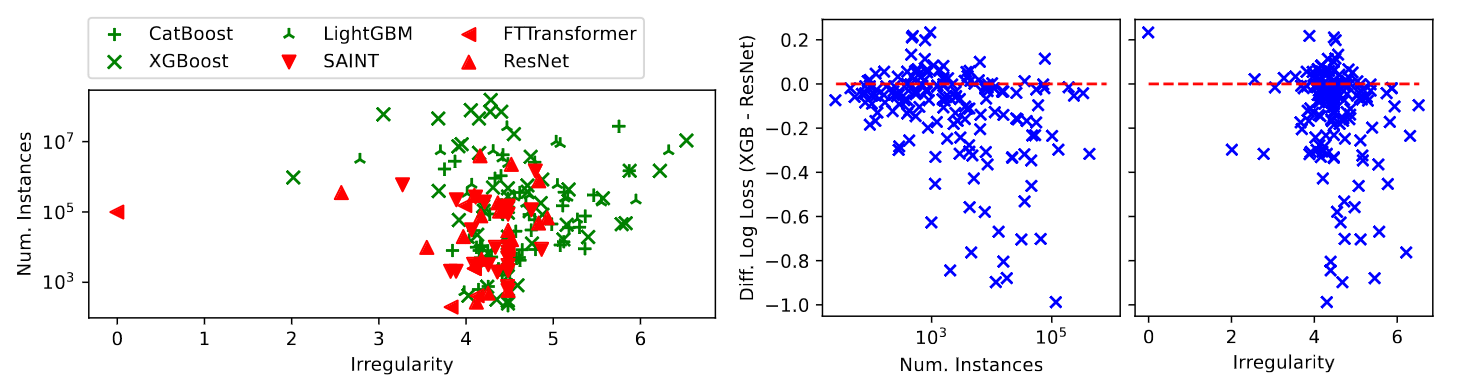
Left: scatterplot of the best algorithm on all 176 datasets across metafeatures. The vertical axis indicates the dataset size, and the horizontal axis combines five dataset metafeatures related to irregularity.
Right: scatterplot of the difference in normalized log loss between XGBoost and ResNet, by dataset size (middle subplot) and irregularity (right subplot). Since lower loss implies a better model, negative Diff Log Loss implies a better model.
The irregularity feature is a linear combination of five standardized dataset attributes: the minimum eigenvalue of the feature covariance matrix (-0.33), the skewness of the standard deviation of all features (0.23), the skewness of the range of all features (0.22), the interquartile range of the harmonic mean of all features (0.21), and the standard deviation of the kurtosis of all features (0.21).
For details on individual datasets in the TabZilla Benchmark Suite, check paper Table-4.
Bonus: A Non-Rigorous Decision Tree for Algorithm Selection
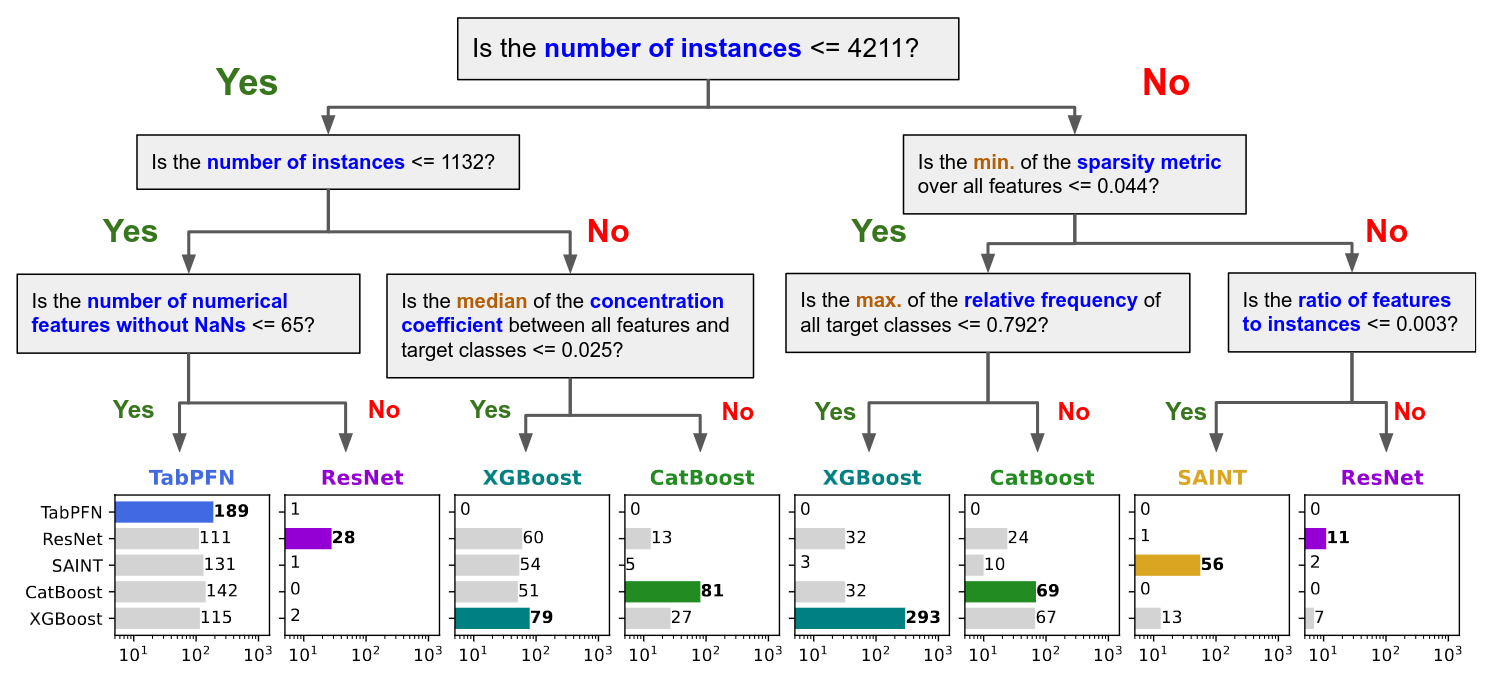
The decision splits are based purely on maximizing information gain at that point in the tree, across 176 datasets.